 If you’re into following the business side of the mobile gaming industry, the Flurry Analytics blog just simply needs to either be in your RSS reader, or the daily rotation of sites you read. It’s a fantastic information overload of charts, data points, and analysis which is the product of having their analytics package included in over 75,000 different iOS and Android apps. Not long ago we posted about some recent findings of theirs that showed that free to play was accounting for 65% of the total revenue that games are raking in compared to “premium" games which went from 61% of the total revenue in January all the way down to 35% a mere six months later.
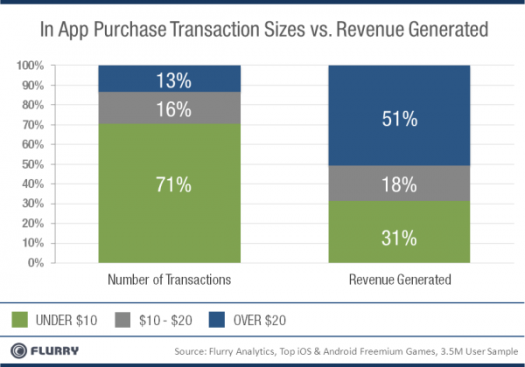
Today Flurry expanded on these numbers, and revealed that of the 3.5m consumers they’re tracking, the average transaction inside of a free to play game is $14. The breakdown of what makes up this $14 average is incredibly interesting as well. For instance, data shows that around 3% of consumers spend money in free to play games, of that 3%, 71% of the transactions that occur are under $10, but 51% of the total revenue generated from these games come from transactions over $20. Check out the chart:

Flurry gets even more in depth with that $14 average:
Let’s spend a moment on the $14 average, which may seem high to you at first blush. There are two reasons the average settles here. First, within the “under $10” bucket, most transactions cluster at the $9.99 level, followed by $4.99, and finally $0.99. In fact, in total, consumers spent $0.99 less than 2% of the time. Why then would so few consumers spend just $1 in freemium games when this price point is so popular among premium games (the pay-before-you-can-play model)? Because freemium games drive a different decision-making mindset for consumers. They simply are deciding whether or not to spend. Our data shows that around 3% of consumers will spend money in freemium games. A deep commitment to the game experience appears to influence their buying habits. The second reason the $14 average seems high is because the high-end of the spending spectrum is very high. Among all purchase price points, over 5% of all purchases are for amounts greater than $50, which rivals the amount paid at retail for top console and PC games
Also, interestingly enough, 30% of that top-tier $20+ transaction are actually over $50, making it beneficial for freemium developers to actually keep “whales" (as Flurry puts it) in mind when developing their games. Some other shocking figures from the same post include the fact that iOS and Android now make up 34% of the portable gaming revenue share, up from 1% in 2008. What’s crazier yet is although Nintendo has taken every opportunity to dismiss smartphones, in that same time frame their revenue share shrank from 75% to 57%, even through the release of the 3DS.
With how quickly both smartphone gaming and the free to play model has taken over in the past six months, I can’t wait to see the Flurry reports six months from now. Nintendo’s shrinking revenue share also has me wondering just how much longer they’re going to remain relevant in the mobile market if they don’t produce something that competes with convergence devices, especially as smartphones get cheaper and more widespread.